New publication from Bröcher et al. in Oecologia: Effects of plant diversity on species-specific herbivory: patterns and mechanisms
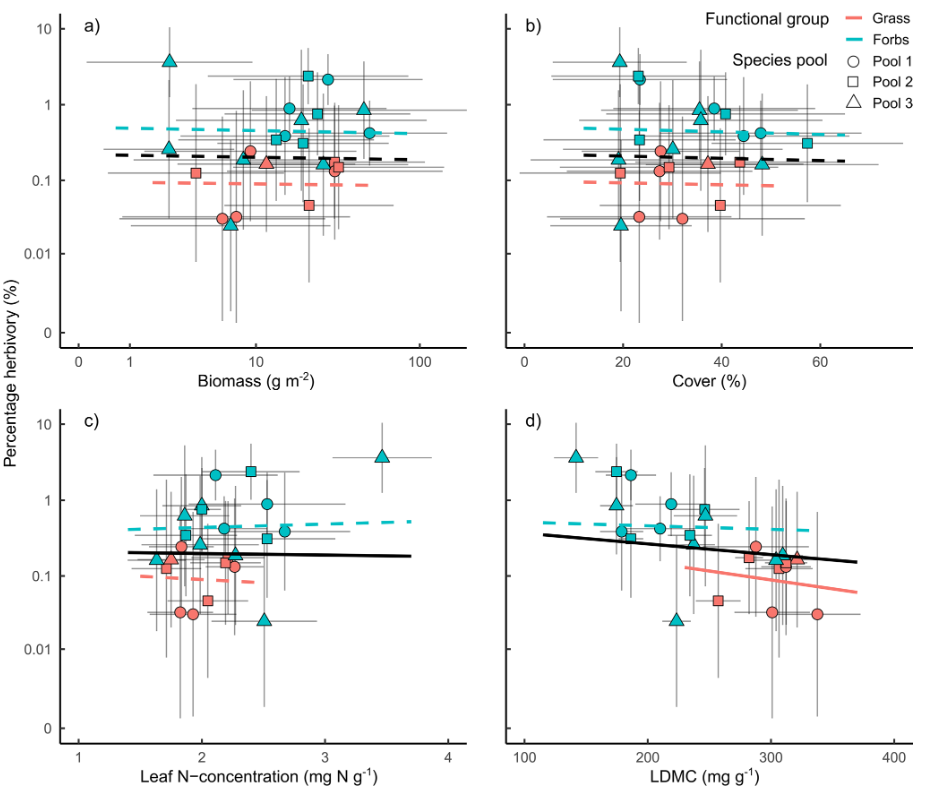
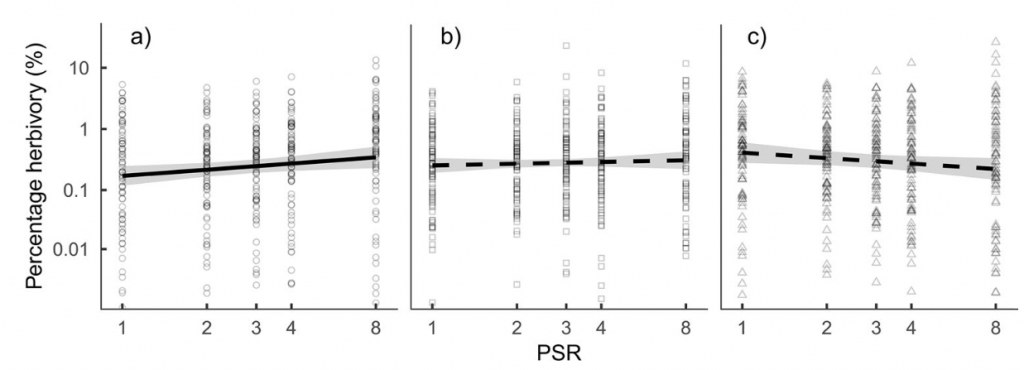
Invertebrate herbivory can shape plant communities when impacting growth and fitness of some plant species more than other species. Previous studies showed that herbivory varies among plant species and that species-specific herbivory is affected by the diversity of the surrounding plant community. However, mechanisms underlying this variation are still poorly understood. In this study, we investigate how plant traits and plant apparency explain differences in herbivory among plant species and we explore the effect of plant community diversity on these species-specific relationships. We found that species differed in the herbivory they experienced. Forbs were three times more damaged by herbivores than grasses. Variability within grasses was caused by differences in leaf dry matter content (LDMC). Furthermore, higher plant diversity increased herbivory on 15 plant species and decreased herbivory on nine species. Variation within forb and grass species in their response to changing plant diversity was best explained by species’ physical resistance (LDMC, forbs) and biomass (grasses). Overall, our results show that herbivory and diversity effects on herbivory differ among species, and that, depending on the plant functional group, either species-specific traits or apparency are driving those differences. Thus, herbivores might selectively consume palatable forbs or abundant grasses with contrasting consequences for plant community composition in grasslands dominated by either forbs or grasses.
Reference:
Bröcher, M., A. Ebeling, L. Hertzog, C. Roscher, W. Weisser, et al. 2023. Effects of plant diversity on species-specific herbivory: patterns and mechanisms. Oecologia. https://doi.org/10.1007/s00442-023-05361-6.